Bazari

Bazari is an investment platform designed specifically for the web3 gaming industry. The platform provides users with historical price data on items that have been bought and sold, allowing gamers and guilds to make informed decisions about when to buy or sell their assets.
Features and Functionality
API Routes and Optimized Page Rendering
The app employs Server-Side Rendering (SSR) to pre-render dynamic content on the server, reducing page load times and ensuring a smooth user experience by delivering ready-to-view pages. For static content that doesn’t change frequently, Static Site Generation (SSG) is used improving performance and SEO by generating pre-rendered pages at build time.
Data Visualization
The application leverages Chart.js and TraderView (Lightweight Charts) to render dynamic, data-driven visualizations. Chart.js is used for creating bar, line, and pie charts to display key metrics and trends with animations and tooltips, while TraderView specializes in visualizing financial or time-series data, such as candlestick charts for fluctuating trends.
AWS Integration for Data Storage
The application integrates AWS DynamoDB and AWS S3 to handle structured data storage and file uploads, ensuring scalability and efficient access. This setup optimizes data retrieval and minimizes unnecessary API calls, improving both performance and user experience.
Search and Filtering Mechanisms
The application provides robust search and filtering functionality, allowing users to refine displayed data efficiently. Input fields and dropdowns on the frontend enable users to define search criteria, while API routes query DynamoDB using optimized searches to deliver relevant results. The refined data is displayed in a paginated or sorted table format, ensuring smooth navigation and performance when handling large datasets.
Key Components
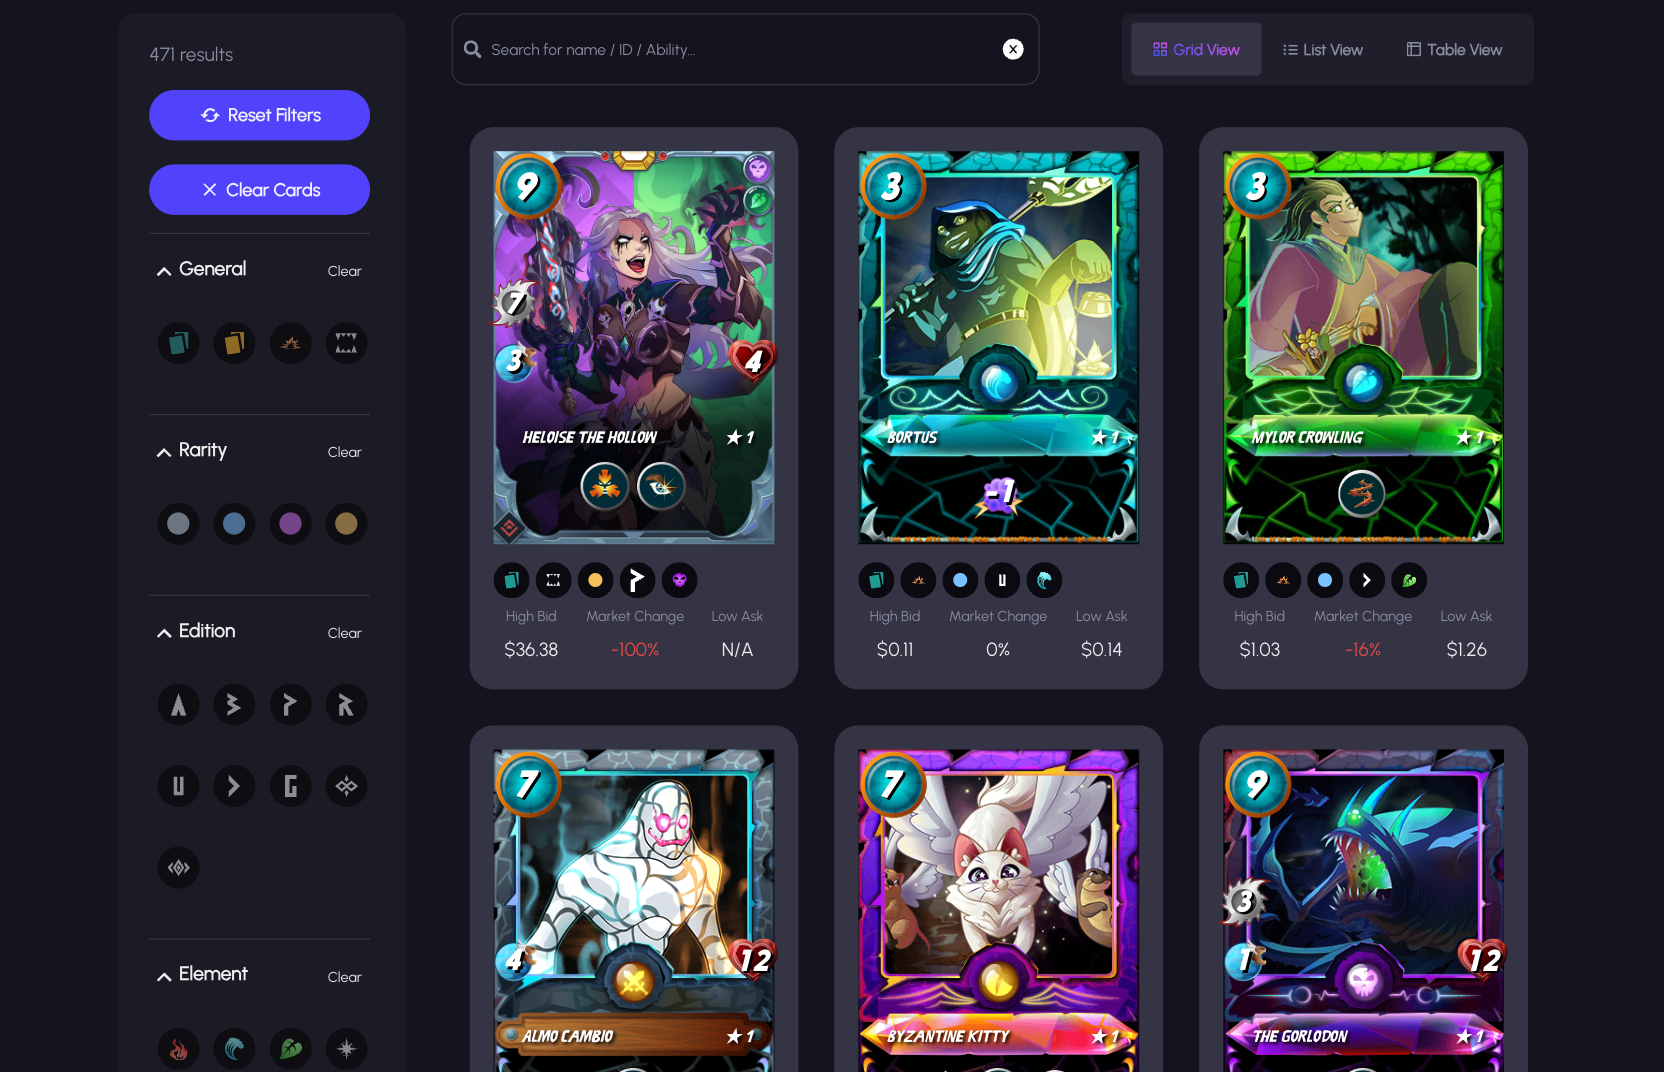
Card Exploration
The Interactive Data Dashboard displays critical market activity metrics using visually engaging and dynamic charts. Each chart highlights specific trends, such as token prices, market caps, battles, user activity, and sales performance, providing a comprehensive view of the market.


Three Viewpoints, One Powerful Market
Having Grid, Table, and Card views provides multiple ways for users to absorb market information based on their preferences. Grid View makes it easy to visually compare card art and see essential stats at a glance. Table View excels at highlighting detailed numerical data side by side for more in‐depth comparisons. Meanwhile, Card View zooms in on a single card, giving a thorough breakdown of its attributes, market performance, and historical trends.


Architecture
Frontend Architecture
Component-Based Design
The frontend is built using Next.js, following a modular and component-driven approach. This ensures reusability, separation of concerns, and optimized rendering for a seamless user experience. Key features such as market transactions, asset comparisons, leaderboards, and interactive charts are structured into well-organized components.
Dynamic Styling
The application uses Chakra UI, providing a highly customizable and accessible design system. The styling is optimized for responsiveness, ensuring a smooth experience across various devices. Themes, color schemes, and UI elements dynamically adjust based on user interactions.
Interactive & Intuitive Visual Components
The application leverages Chart.js and TradingView to deliver visually engaging, dynamic data representations. Users can interact with real-time and historical market trends, gaining deep insights into game asset performance across multiple timeframes.
Diverse Charting & Data Insights
The app includes real-time market trends, multi-interval breakdowns, leaderboards, transaction analytics, asset comparisons, and market overviews using various chart types such as candlestick, line, bar, scatter, and pie charts. Tooltips, annotations, and interactive legends enhance usability for in-depth analysis.
Backend Architecture
API-Driven Data Processing
The backend utilizes Next.js API Routes to efficiently fetch, process, and serve game data. It handles market transactions, asset details, and leaderboard rankings while optimizing API calls to reduce latency and prevent throttling.
Scalable Data Caching & Storage
To enhance performance and mitigate API rate limits, the app caches frequently accessed data in AWS S3, ensuring faster retrieval and a smoother user experience without excessive third-party API dependencies.
Robust Error Handling & Performance Optimization
The backend implements retry mechanisms, lazy loading, and server-side caching to handle API failures gracefully, improve load times, and ensure a seamless data flow for all users.


